Abrstract — A Look at BRT Viability as an Alternative Solution to the United States Congestion-Relief Funding Crisis
The Congestion Funding Challenge
In the coming decades, as many as 100 million new people (US Census Bureau, 2014) will immigrate to, be born in, or be blessed with a longer life in United States cities. Currently over 80 percent of this country’s population live in urbanized areas (US Census Bureau, 2010) whose transportation needs will become challenging and expensive to plan for.
Since the Second World War, federal and state transportation officials have invested in highways for private motor vehicles as a primary solution to meet urban mobility needs. Today, the US Department of Transportation has grown concerned that it may no longer be able to fund maintenance of critical national and interstate highways beyond 2029 (US Department of Transportation, 2014). In fact, a decline in revenue from the motor fuel excise tax will force the department to “implement a cash management plan beginning August 1 to manage the flow of federal dollars. Under this plan, reimbursements to states for infrastructure work will be limited to the available cash in the Trust Fund” (US Department of Transportation, 2014).
It is true that the Trust Fund is primarily spent to maintain rural, inter-city, and inter-state travel routes. But many of these routes, especially Interstate highways, do become critical urban travel routes inside cities. If the fund is not bridged, states will have to scrounge together their own financing to maintain these routes, which robs revenue that could be used to solve urban transportation issues.
This could not pile on states at a worse time, as most are already face their own shortfalls. This includes Utah which needs to bridge an $11.3-billion-dollar price tag, which the non-profit group Trip: A National Transportation Research Group (TRIP) claims is needed, to address the bare-minimum urban mobility problems over the next two decades (TRIP, 2015).
There is some buzz around raising the federal gas tax, but it would not likely expand revenue beyond historic norms, which would leave states (at best) a status quo where congestion relief projects continue to be underfunded. A few states raised their fuel taxes during 2014, including Virginia, New York, Pennsylvania, Florida, and Maryland (Washington TImes, 2015), with other states like Tennessee and Utah hoping to follow suit in 2015. But most of these hikes are very modest (as small as 0.3 percent in Florida’s case) and do little to address an immediate shortfall, let alone to create a vision for long-term congestion relief.
Since highway transportation for private vehicles has a higher cost-per-engagement for each user than other modes of transportation, it is reasonable to consider supplementing future plans with additional, cheaper transportation modes to reduce congestion relief’s overall price tag. States and regional planners may want to consider transit, which includes constructing or expanding subway, bus rapid transit (BRT), and local bus service.
Options for Non-Capacity-Expansion Congestion Solutions
Subway
For many road users and transportation officials, subways are a very sexy congestion-relief solution. They offer cities a solution that offers an air of exclusivity, as only 12 cities in the US have underground metro rail systems.
The trouble with subway is their astronomical cost. The transit agency that serves the city of Los Angeles plans to expand its “purple line” across town to the UCLA campus (Metro LA, 2013). Just the first three, and least-technically challenging, miles of the seven-and-a-half mile project will cost nearly $3 billion dollars (Southern California Association of Governments, 2012). The overall project could easily spend into an almost unimaginable eleven-figure price tag. That outspends some states’ entire annual budgets for everything, simply to address congestion along a single seven-mile corridor.
Additionally, construction is slow and painful. The “purple line” project when totally funded will take decades to build and creates traffic impacts across the city as roads are removed and strengthened to prepare for a tunnel boring machine.
Local Bus
On the other extreme of the cost spectrum is traditional bus service. The universal appeal to this mode is it is nearly 100 percent operational expense, as the capital costs are not much more than the buses, a few shelters, and some cheap signs.
Sadly, anecdotal evidence shows that while local bus is helpful for vulnerable populations, it is generally ineffective to address overall congestion issues. Bus service, even on express corridors, is generally slow which makes it an unattractive alternative to private-vehicle driving. Local buses travel in general-purpose lanes, which get them stuck inside the very traffic jams they were deployed into to solve.
Bus Rapid Transit
Bus Rapid Transit (BRT), when fully-developed, acts a type of a “surface subway,” offers high quality, high capacity rapid transit at a price cheaper than traditional commuter or light-rail trains, and at a tenth (or even hundredth) of the cost of a traditional subway line.
Many nickname it as “light rail on tires,” as it acts functionally similar to a light-rail train (LRT), but has much cheaper up-front capital expenses, makes it more financially feasible for medium-sized urban areas that warrant a powerful transit corridor but cannot justify the construction costs of a LRT system.
A BRT system consists of five main “rapid transit” components (Alameda-Contra Costa Transit District, 2015), which to be effective must include:
- Dedicated Transit-way Lanes: Usually a 24-foot center-running surface street right-of-way that only permits bus traffic. This allows a bus to bypass congestion and traffic jams which allows a consistent schedule and speedy travel times regardless how crowded the road becomes.
- Signal Priority: A BRT vehicle will be integrated into an Intelligent Transportation System (ITS) which allows an intersection to cycle green for an approaching BRT bus. This, in conjunction with dedicated right-of-way, is key to keep the system effective and speedy even when the traffic flow in the general-purpose lanes become unstable.
- Stations: Delay as boarding passengers to pay their fare slows traditional bus service. Offering a kiosk allows passengers to pre-purchase their fare before the bus arrives and reduces dwell time during stops. Like a subway, stations are typically spaced much farther apart than stops on a local bus route, which also reduces dwell and restart time. On some BRT systems, like TransMilenio in Bogota, Columbia even have automatic sliding glass doors on the platform, which creates a subway-like experience for passengers (Federal Transit Administration, 2006).
- Vehicles: A local bus has a single boarding entrance, which increases dwell time and slows performance. An efficient BRT vehicle, like a subway car, has many doors to allow passengers to speedily enter and exit.
- Service: Like a subway system, BRT is intended to offer frequent, all-day service that follows a simple, easy-to-understand route. Ideally a rider should be able to navigate the system without a map, and the route should be frequent enough the rider would not need to look at a schedule.
Grade separation is very useful as it carries transit vehicles above or below congested intersections and crowded city streets and freeways. The trouble is, infrastructure becomes very expensive once grade-separation is used as it requires expensive structural engineering and construction. With the features listed above, the hope is that BRT can offer the benefits of a fully-grade-separated transit facility with a much smaller cost.
Current Research into BRT Performance
A planner may consider if a BRT system can really meet the high-level performance goals needed to be a serious congestion-fighting tool in a regional’s transportation plan. BRT is cheaper than a traditional mile of subway, commuter rail, or light rail. But as BRT requires its own right-of-way, we know it is not cheaper than to simply skip building stations and buying buses and to offer that lane to general-purpose traffic.
To determine if a BRT system on dedicated lanes offers better long-term value and effectiveness to a region than to simply open those lanes to traffic, we must first identify what proof of performance we should consider as we observe other systems and overall research:
Proof of Performance Criteria
- Cost Effectiveness: Is the cost per engagement (cost per passenger per mile) better in a fully-developed BRT system than a traditional lane mile?
- Travel Time: Are typical travel times faster for a rider on a fully-developed BRT system than in a private automobile which uses the right-of-way as a general purpose travel lane?
- Land Use: Does BRT offer substantial land-use pattern changes that promote density and decrease vehicle miles traveled (VMT)? Do these changes reap enough future benefits to outweigh immediate reductions in private vehicle travel performance?
Assets Offered
Current research into BRT seems to focus around a few established BRT systems, specifically:
- The TransMilenio in Bogota, Columbia, and its counterparts in Brazil (2000).
- The Goyang-Susaek in Seoul, Korea (2010).
- The Delhi BRT in Dehli, India (2008).
- The Orange Line in Los Angeles, California, USA (2005).
- Various BRT projects in smaller Chinese cities, which are adding “BRT lane-km at a faster pace than anywhere” (Cervero, 2014).
Cost Effectiveness
BRT has “greater operating flexibility and potentially lower capital and operating costs than light rail” (Zimmerman, 2006). The barrier to warrant construction is lower for BRT than it is for more traditional forms of transit investment. In the United States, a LRT system needs 50 jobs/residents per acre to meet general cost effectiveness. For BRT, that number slices in a third to just 18 jobs/residents per acre (Cervero, 2014). That opens up much larger buffers for planners to identify new transit corridors.
To put that in actual dollars and cents, LA Metro told Planning they consider BRT to be a bargain. “The underground subway cost $258 million a mile to build and surface-level light rail has cost $44 million a mile, on average. The Orange Line, at a total cost of $330 million, came in at $24 million a mile” (Swope, 2006).
A successful BRT system can, theoretically, cease being a liability for the agency that owns it. For instance, “in Latin America, some well-designed BRT systems are fully self-financing. Evidence from Porto Alegre (Brazil) has shown the BRT systems operate with no public subsidies and return a profit to private sector firms, whereas an urban rail system requires a 70% subsidy for each passenger trip in similar circumstances” (Deng, 2013). This kind of financial proof of performance is key to attracting capital for future system investment.
Travel Time
A BRT system is not a race car, but is competitive with more expensive transit systems. In its own dedicated lane on an arterial street, a BRT “typically ranges from 11 to 19 miles per hour.” That’s essentially equal to speeds a center-running LRT system sees. BRT can reach 35 to 50 miles per hour on freeways and busways (Zimmerman, 2006), which is comparable to a subway system.
In Korea, BRT has demonstrated huge success (fig. 1). Since implementing BRT, the city has seen improvement in overall travel times on congested corridors. This benefit is seen not just for transit riders, but even for increased speed for private motor vehicles:
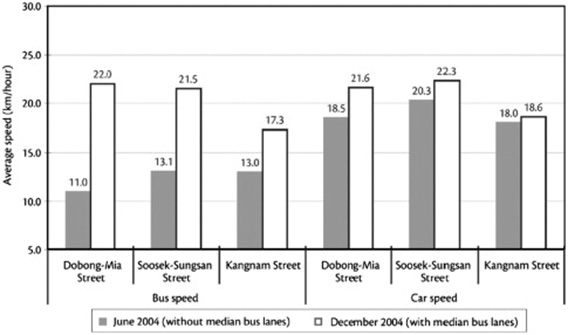
Seoul’s planners are thrilled with BRT’s ability to carry so many passengers, say the project “contributed to increased bus ridership, reduction of traffic congestion in the BRT corridors, and increased development density in the urban centers, therefore serving as a counterforce to urban sprawl” (Jun, 2012).
These metrics were so successful in the city’s center, planners centered BRT inside a massive urban renewal project, “which demolished surface streets, elevated highways and restored previously-existing waterways to downtown Seoul. The local government took a system-wide approach and provided full financial and administrative support to ensure that the BRT was able to compensate for losses in commuter capacity and rerouted traffic due to this freeway demolition” (Jun, 2012).
In South America, a project in Brazil that is just five years old has seen enormous success. “Curitiba’s BRT … carries 45 percent of motorized trips in the city, the highest share in Latin America” (Santos, 2011).
Land Use
In Bogota, planners have seen some modest density increase since TransMilenio opened nearly fifteen years ago. The claim “average building density [has seen an] increase [of] 6 percent for areas near trunk and feeder lines versus 10 percent for the rest of the city” (Cervero, 2014). They believe it may increase property values, as they have seen “multi-family housing units close to Bogotá’s TransMilenio BRT rented for more per square meter than units located farther away” (Cervero, 2014). If true, higher prices would incentivize higher-density development.
In the United States, agencies are quick to rave about BRT’s success. The Massachusetts Bay Transportation Authority recently bragged that their Silver Line BRT “has spurred $500 million in new development and redevelopment near stations” (Zimmerman, 2006). And there appears to be some “significant development activities around BRT stops in Pittsburgh, Ottawa, and Adelaide” however researchers do admit they do not have a control sample to compare it to (Cervero, 2014). So it is quite possible BRT was not a density generator, but rather, a simple magnet that attracted existing developments to its transit stops. One could argue that is not a bad consolation prize, as it creates better zoning organization. It is better for a high-density project to be attracted to a transit stop than to a freeway interchange or large boulevard.
Also a comfort for planners, is recent research which shows that while it is important than BRT has higher-densities adjacent to stations to generate performance to justify its expense, “densities need not be as high as for light-rail or heavy-rail (metrorail) services” (Cervero, 2014).
Liabilities to Consider
Cost Effectiveness
Self-financing is the goal, but very few BRT systems have seen it happen. Latin American BRT systems have had better success than systems in the United States. China has only one self-financing system, the Guangzhou BRT, which “is quite capable of operating without a subsidy because of its huge passenger demand.” But China chooses to still subsidize it anyway (Deng, 2013). All systems in the United States are heavily subsidized, often as much as 90-percent or more.
Initial construction costs and interest from bonds may explain why BRT is more successful in less-developed places like Brazil and more of a money pit in more-developed countries: “Labor costs in developing countries are significantly less than those in developed countries, operating costs (primarily staff salaries) could be substantially less” (Deng, 2013).
Travel Time
The benefit from BRT are lackluster at taming China’s rapidly emerging car culture. “Compared with Latin American BRT, Chinese BRT systems operate at a comparable speed but carry much fewer passengers” (Deng, 2013).
It could have something to do with recent Chinese development patterns, which center on large arterial boulevards more similar to the United States. But even older city like Seoul, with narrow urban streets, still suffer from BRT construction in “inappropriate locations (most systems are located either in peripheral corridors) … [and] has resulted in low to medium passenger demand” (Deng, 2013).
A study of the Dehli BRT casts further doubt if BRT offers inherit travel time benefits. Researchers initially found an increase speed, but credited most of that to BRT acting as a street median which reduced vehicle conflict points. Additionally, their statistical base case and test case had so much overlap, they were forced to concluded that “the average speed of [private motor vehicle] has not significantly reduced after BRT corridor has become operational” (Tiwari, 2012).
Land Use
It does not appear transit is as influential on land use patterns as planners would like to hope. A 1990s study on the highly-successful Bay Area Rapid Transit (BART) system in San Francisco found the train contributed to increased commercial activities downtown, with no perceptible impacts on residential settings in the suburbs” (R. Cervero, 1997).
It is not likely BRT will be more influential, as research has demonstrated “development impacts of BRT were substantially lower than those of light-rail transit (LRT)” (Vuchic, 2002). In the Seoul project, planners found “BRT [had] limited effects on residential activities, implying that accessibility benefits due to the BRT are not sufficient to generate significant changes in residential location,” although they too did see increased activity in the city center (Jun, 2012).
Dense urban development is not a guaranteed global trend. In fact, evidence seems to imply that suburbanization may be happening more rapidly than urbanization. “From 1990 to 2000, average urban densities “fell from 3545 to 2825 people per km2 in developed countries, declining in all 32 developed cities surveyed by the World Bank” (Cervero, 2014).
Systems with disappointing performance, like most BRT lines in China, have left researchers to pessimistically conclude that BRT’s ability to promote density “mixed-use, pedestrian-friendly development organized around a transit station – on a significant scale largely remains an unsettled question” (Cervero, 2014).
Opinion of BRT Viability
Cost Effectiveness
If a planner’s primary goal is congestion relief, it is a concern to see such mixed results. Certainly the outcomes in Brazil and Colombia offer promise, but the lackluster outcome in China pours proverbial water on the flame of enthusiasm.
If we take a few steps back and look at the larger picture, opportunity cost seems to be a serious concern. Even the most exceptional BRT systems may not move as many people per hour as private vehicle travel using the same space. For example, one of the largest BRT buses carries fewer than 120 passengers (National BRT Institute, 2006), and that assumes full occupancy (every seat taken and a maximum-allowed number of standing passengers). A highway lane can carry 1650 vehicles per lane per hour under stable flow conditions. As the road approaches unstable flow, it can reach a maximum of over 2200 vehicles per lane per hour (Dr. Lloyd Herman, 2013).
In a direct comparison, it would take 14 suffocatingly-full BRT vehicles to match the carrying capacity of a general purpose travel lane, assuming each private vehicle carries only one passenger. As the road approaches unstable flow, that number climbs to 18. That means a BRT system must have frequency beyond five-minute headways with the bus at full capacity to justify its benefit. The unique value BRT offers is its ability to still perform well even after the general purpose lanes become unstable, just like a subway or elevated train. Meanwhile the traffic flow for private vehicles can plunge from 2200 vehicles per lane per mile to, theoretically, zero at gridlock.
Therefore, BRT is a poor option for roads with a level of service (LOS) at or near D or E, but would return to a LOS C or better if additional travel capacity is added. BRT is a good option on roads which are incurably LOS E or F and are likely to remain (or quickly return to) LOS E or F even with added capacity.
Travel Time
In these congested LOS F conditions, BRT seems to work well. That may explain why travel time on the system in Seoul has been a phenomenal success, while some systems in China (surrounded by networks of eight-lane arterial roads) fail miserably. When private motor vehicle speeds exceed 19 miles per hour on city streets (often substantially), who would want to stand out in the rain and wait for a bus? But if a commute involves countless red lights and single-digit travel speeds, BRT may seem appealing.
A system can only perform as well as it is designed to perform. Even a successful system like TransMilenio suffers from stops placed in the medians of active roadways which “inevitably means a poor-quality pedestrian-access environment and thus little commercial development near the stations themselves” (Cervero, 2014).
Even little design features, like a model of pedestrian movement at stations is a “fundamental component in estimating BRT station bus capacity” and to reduce dwell time at stops (Jaiswal, 2010).
Little design flaws, like these, effectively destroy BRT’s benefits, which render it a very expensive local bus route. And complicated statistical research verifies what our intuition already tells us: “To attract more passengers the LRT [and BRT] must offer a more trustworthy and more frequent service (fewer delays) than the bus” (Dell’Olio, 2012).
An informed planner must concede that even the most thoroughly researched BRT systems often only have five-to-seven years of data to observe. It is still far too early to see all the permanent shifts in commuting patterns, and therefore, too early to write off as a failed system.
Land Use
Data exploring transit’s impact on land use patterns is quite disappointing. This is especially true for the Bay Area Rapid Transit (BART) study which observed land use changes over a twenty-year period. It seems to nearly kill the argument transit planners make that, to quote the film Field of Dreams, “if you build it, they will come.” It sounds like development exists in its own closed system which is influenced more by average salaries and public expectation than it is by transit. If a real estate market is weak, transit cannot overcome it (Cervero, 2014).
If transit systems, particularly BRT, fail to increase station-adjacent land prices, it will never warrant enough marketplace force to organically incite the kind of high-density development transit planners bet on. If they must see this development to make the system financially sustainable, they’ll find themselves financially stuck. The BRT system becomes an allegorical “white elephant,” where operational costs will be too costly to “feed”, but the capital improvements were too expensive to simply dispose of.
Conclusion
BRT is a neat tool in a planner’s toolbox, but like other modes of transportation, is not a cure-all to a city’s transportation woes.
A planner should only implement BRT along corridors that are, or projected to be, LOS F, after all financially and practically prudent efforts have been made to address congestion through traditional capacity expansion, such as the LA Metro Orange Line and the Seoul Goyang-Susaek Line. The research appears to make it clear that BRT generally will not generate demand for itself, as demonstrated in the BART study, but transit (and BRT) can competently gobble up a massive workload of travel demand when the surrounding land use produces it.
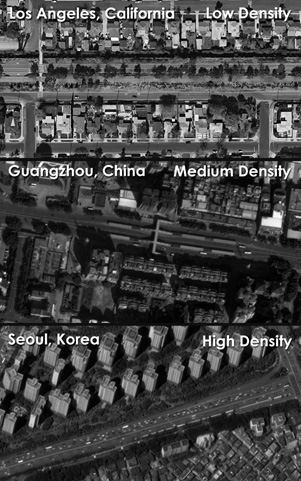
Land use density is not an automatic determiner of BRT success. The BRT lines in Seoul and Los Angeles are much more successful than the line in Guandzhou, China. Anecdotal evidence from Google Maps imagery shows many parallel wide arterial boulevards with plenty of highway capacity in Guangzhou. Streets in Seoul, Korea all appear to have unstable flow, due to the very, very intense land use of the city. Land use in Los Angeles, by comparison, is very low density by comparison. However, long-distance commute patterns means high VMTs per road user, which increases their exposure to the road, which creates unstable flow on all the streets, which may explain the Orange Line’s dedicated-right-of-way success. This seems to indicate that to offer service faster than prevailing highway conditions is a better indicator of BRT’s success than the intensity of surrounding land use.
That aside, a city or planning agency would be wise to drop planned “low-density” BRT routes from the long-range development plans, as it is unlikely the land use intensity will change in the foreseeable future, and such corridors are quite likely to see near-to-medium-term improvement from street widening projects. Research shows transit has demonstrated a poor ability to transform suburban locations into urban ones, BRT should not been viewed as a sprawl-transforming magic wand.
Rather, BRT should been seen as a tool to serve existing urban corridors (or suburban corridors projected to organically become urban corridors) than cannot, in themselves, warrant subway or LRT construction, but will benefit from service beyond traditional local service. Many urban corridors meet this criteria, so to identify new viable BRT corridors does not appear to be difficult for a transportation official to do.
Works Cited
Alameda-Contra Costa Transit District. (2015). What is BRT? Retrieved from AC Transit: http://www.actransit.org/planning-focus/your-guide-to-bus-rapid-transit/351-2/
Cervero, R. D. (2014, November). BRT TOD: Leveraging transit oriented development with bus rapid transit investments. Transport Policy, pp. 127-138.
Dell’Olio, L. I. (2012, September). Passenger preference analysis: light rail transit or bus versus car. Transport, pp. 276-285.
Deng, T. M. (2013, September). Evaluation of Bus Rapid Transit Implementation in China: Current Performance and Progress. Journal of Urban Planning & Development, pp. 226-234.
Dr. Lloyd Herman, O. S. (2013). Traffic Parameters. Retrieved from http://www.ohio.edu/people/hermanl/ce361/Traffic%20Parameters.pdf
Federal Transit Administration. (2006, May). Applicability of Bogota’s TransMilenio BRT System to the United States. Retrieved from http://www.fta.dot.gov/documents/Bogota_Report_Final_Report_May_2006.pdf
Jaiswal, S. B. (2010, December). Influence of Platform Walking on BRT Station Bus Dwell Time Estimation: Australian Analysis. Journal of Transportation Engineering, pp. 1173-1179.
Jun, M.-J. (2012, January). Redistributive effects of bus rapid transit (BRT) on development patterns and property values in Seoul, Korea. Transport Policy, pp. 85-92.
Metro LA. (2013). Retrieved from Purple Line Extension: http://media.metro.net/projects_studies/westside/images/project_map.pdf
National BRT Institute. (2006). Bus Comparison. Retrieved from http://www.nbrti.org/docs/pdf/2006_brt_compendium.pdf
Cervero, J. L. (1997). Twenty years of the bay area rapid transit system: land use and development impacts. Transportation Research, pp. 309-333.
Southern California Association of Governments. (2012). 2012-2035 RTP. Retrieved from http://rtpscs.scag.ca.gov/Documents/2012/final/SR/2012fRTP_ProjectList.pdf
Swope, C. (2006, May). L.A. Banks on Buses. Planning, pp. 32-36.
Tiwari, G. (2012, May). Accessibility and safety indicators for all road users: case study Delhi BRT. Journal of Transport Geography, pp. 87-95.
TRIP. (2015, March). Utah’s Most Critical Surface Transportation. Retrieved from http://tripnet.org/docs/UT_Economic_Development_TRIP_Report_Mar_2015.pdf
US Census Bureau. (2010). How many people reside in urban or rural areas for the 2010 Census? What percentage of the U.S. population is urban or rural? Retrieved from Frequently Asked Questions: https://ask.census.gov/faq.php?id=5000&faqId=5971
US Census Bureau. (2014). Projections of the Population and Components of Change for the United States: 2015 to 2060. Retrieved from 2014 National Population Projections: Summary Tables: https://www.census.gov/population/projections/data/national/2014/summarytables.html
US Department of Transportation. (2014). Highway Trust Fund Ticker. Retrieved from http://www.dot.gov/highway-trust-fund-ticker
Vuchic, V. (2002, May). Bus semirapid transit model development and evaluation. Journal of Public Transportation, pp. 71-96.
Washington TImes. (2015, January 3). Washington TImes. Retrieved from New Year’s gas tax increases hit states, hike up fuel prices: http://www.washingtontimes.com/news/2015/jan/3/new-years-gas-tax-increases-hit-states-hike-up-fue/
Zimmerman, S. L. (2006, May). The Facts About BRT. Planning, pp. 34-34.